Walk into almost any company today and you’ll find the same tension simmering quietly beneath the surface: organizations are data-rich but insight-poor. Every department uses a different analytics tool. Dashboards multiply like rabbits. Reports contradict each other. Meetings are spent arguing about whose version of the truth is correct, not what to do next. Meanwhile, business operations are becoming more complex, more distributed, and more dependent on systems that rarely talk to each other cleanly.
This is the world SurrealXP was designed for.
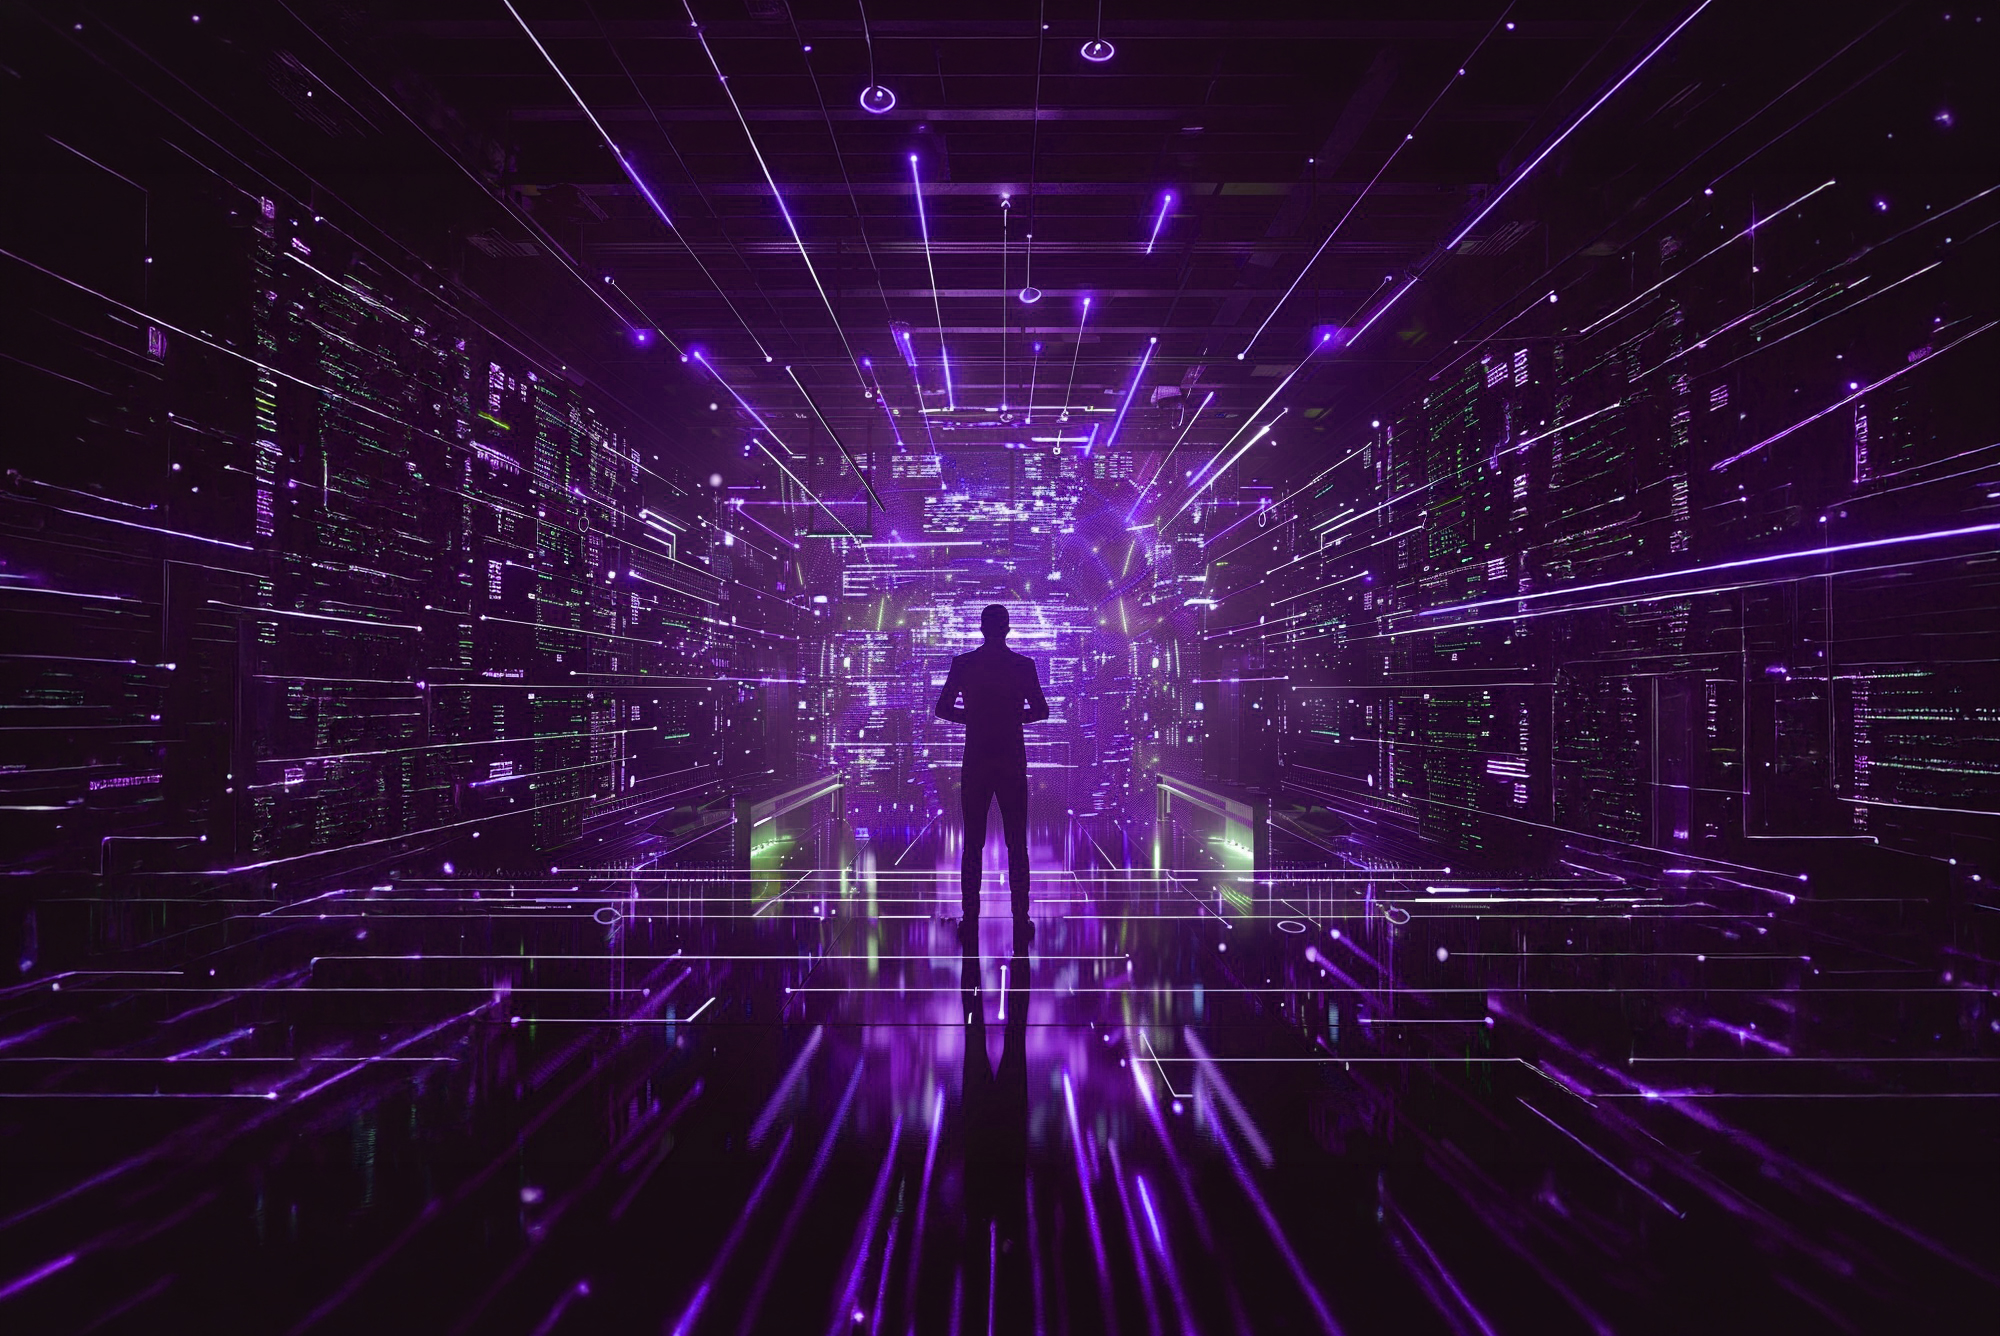
SurrealXP is a spatial data intelligence platform built on NVIDIA Omniverse that brings your enterprise data into a unified, immersive 3D environment. Instead of staring at spreadsheets or static charts, teams can walk through a real-time digital representation of their operations, understand patterns at a glance, and collaborate as if they’re inside the business itself.
This article breaks down how SurrealXP works in real industry settings and the practical benefits companies see when they deploy it. If you’re tired of theoretical “future of work” talk and want to understand actual use cases, buckle in — this is where immersion meets operational clarity in a way that actually makes business sense.
A New Way to Think About Data: Spatial Intelligence
Traditional BI tools show information in two dimensions. Fine for simple charts. Not great when you’re dealing with dozens of systems, thousands of variables, and operational environments that behave like living organisms.
SurrealXP resolves this by transforming enterprise systems into spatial, explorable environments. These environments can represent real places — like a factory floor or a power grid — or abstract ones — like a financial ecosystem or risk landscape.
The point is simple:
Your brain understands space faster than spreadsheets.
Spatial computing taps into how humans are wired. When you can see relationships instead of interpreting them through tables, patterns emerge faster, anomalies stand out more clearly, and decisions happen in real time. Let’s talk practical industry examples.
1. Manufacturing: The Real-Time Digital Factory Floor
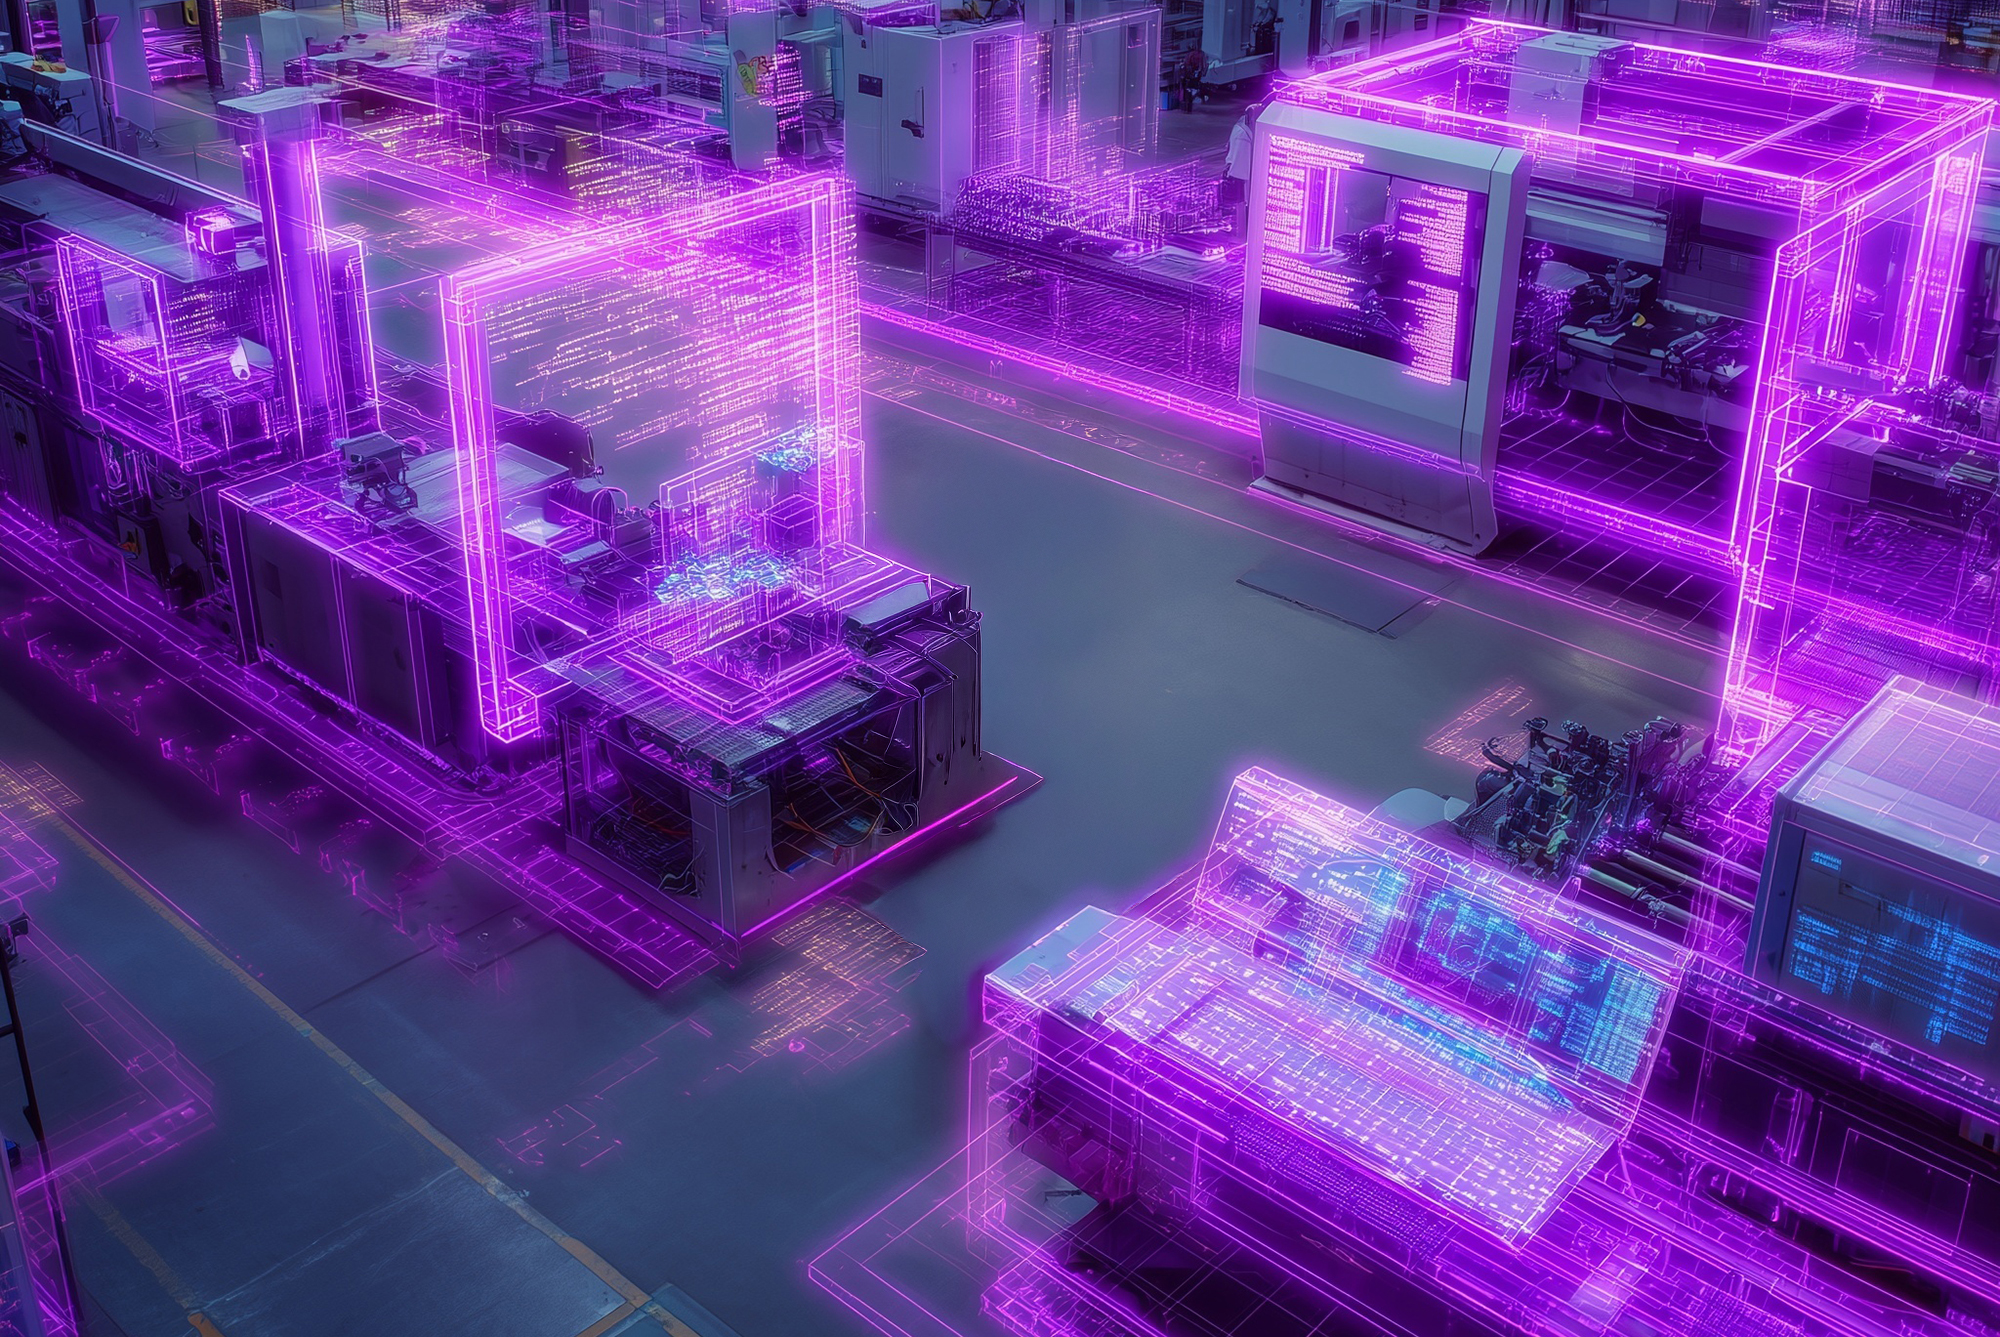
Manufacturers have been chasing the idea of a “digital twin” for years, but most implementations stop at static 3D models or half-connected dashboards. SurrealXP brings the factory to life — in real time.
How It Works
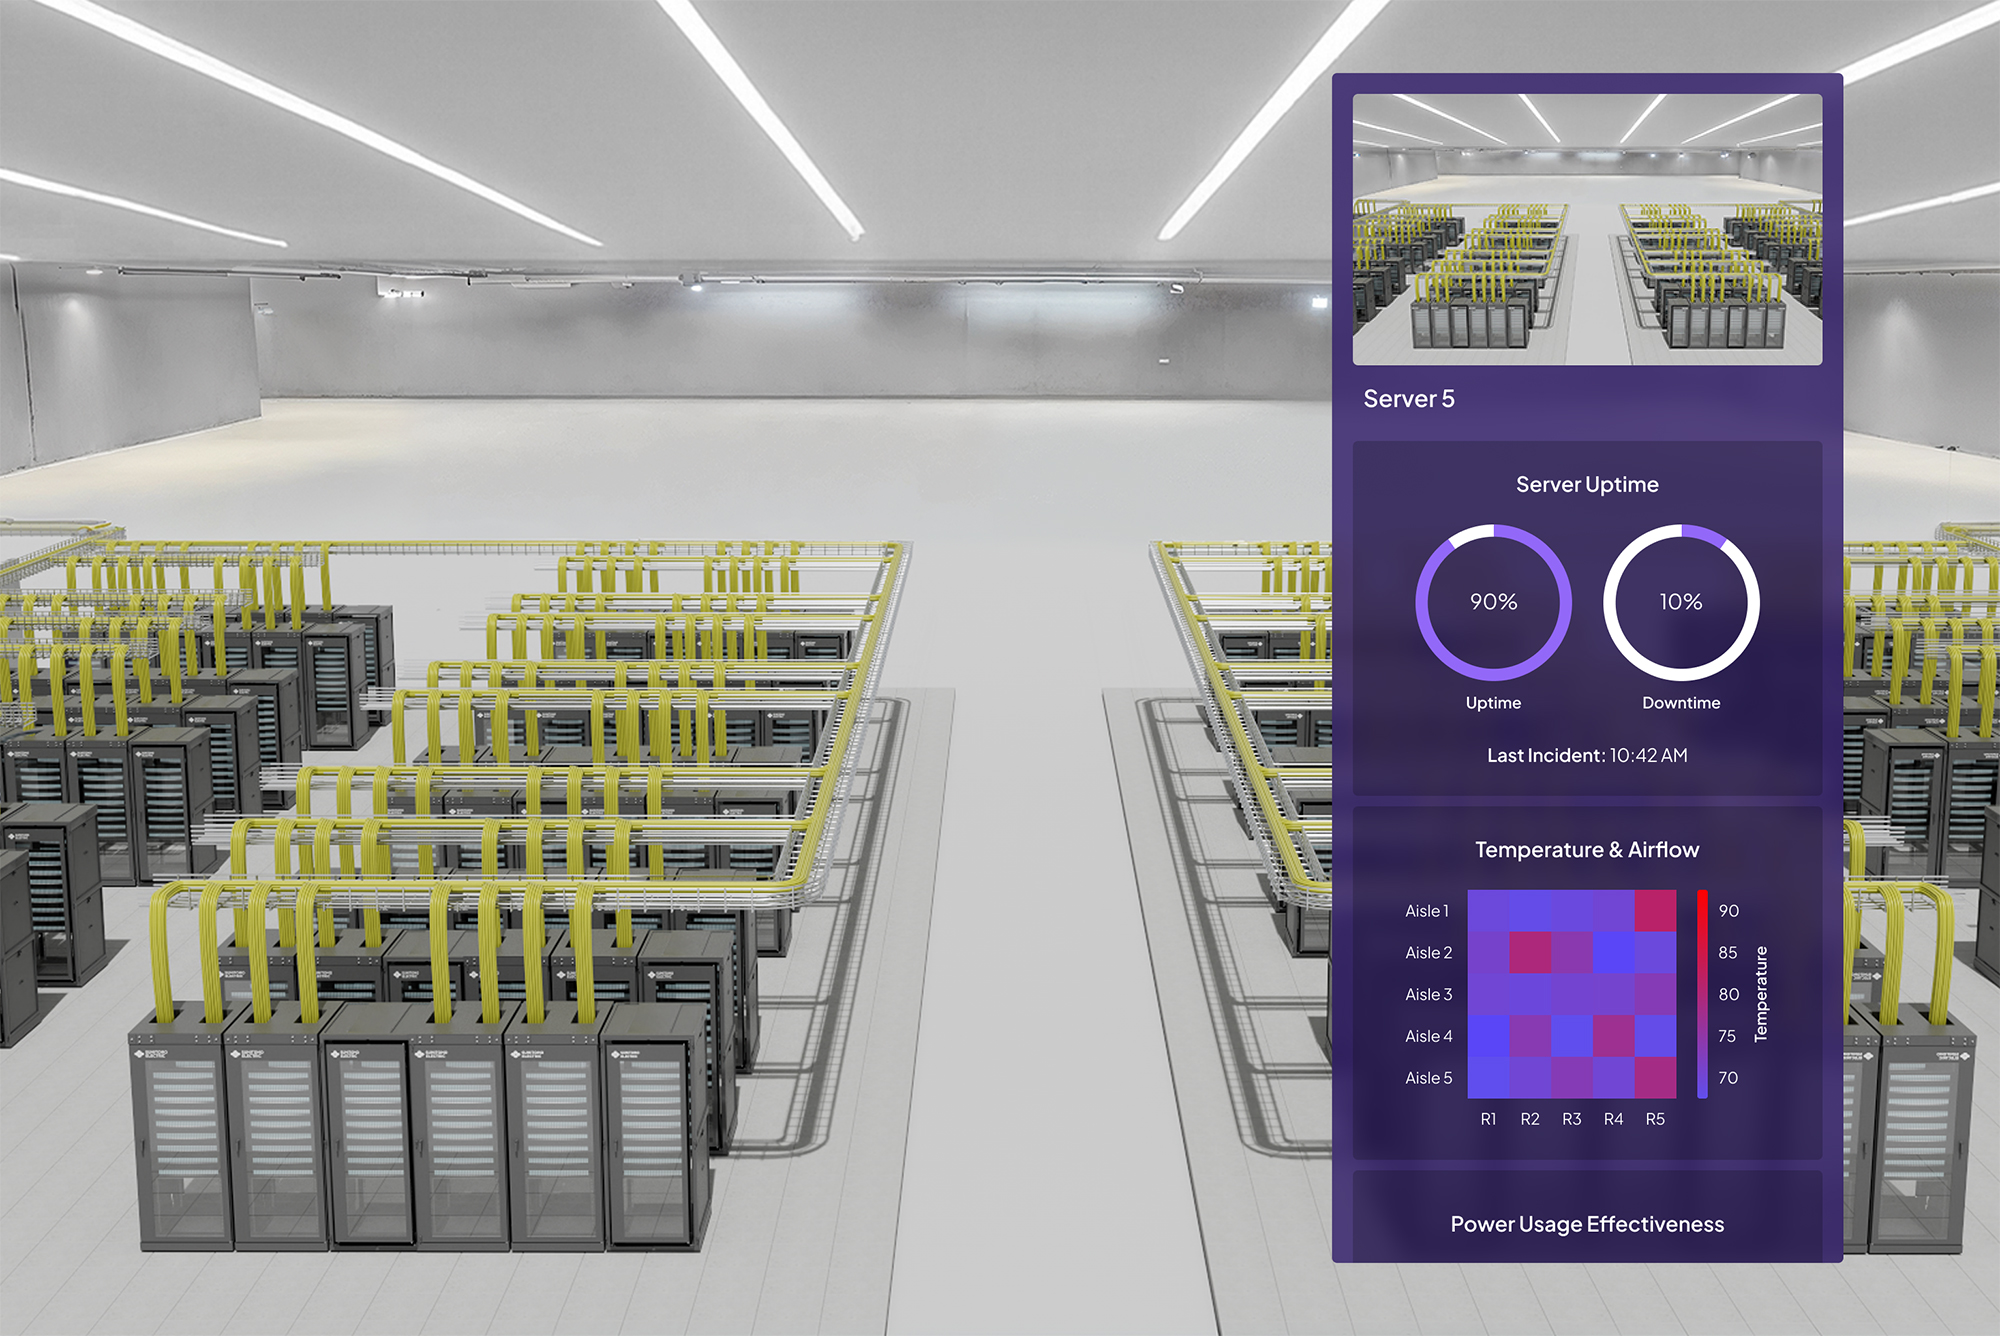
SurrealXP connects to IoT sensors, MES, ERP systems (like SAP), maintenance logs, and Power BI datasets. It creates a living digital factory where:
• Machines update their status within seconds
• Conveyor lines visually display throughput
• Maintenance issues glow in context
• Energy usage flows across the map as heat patterns
• Predictive models highlight risks before they become downtime
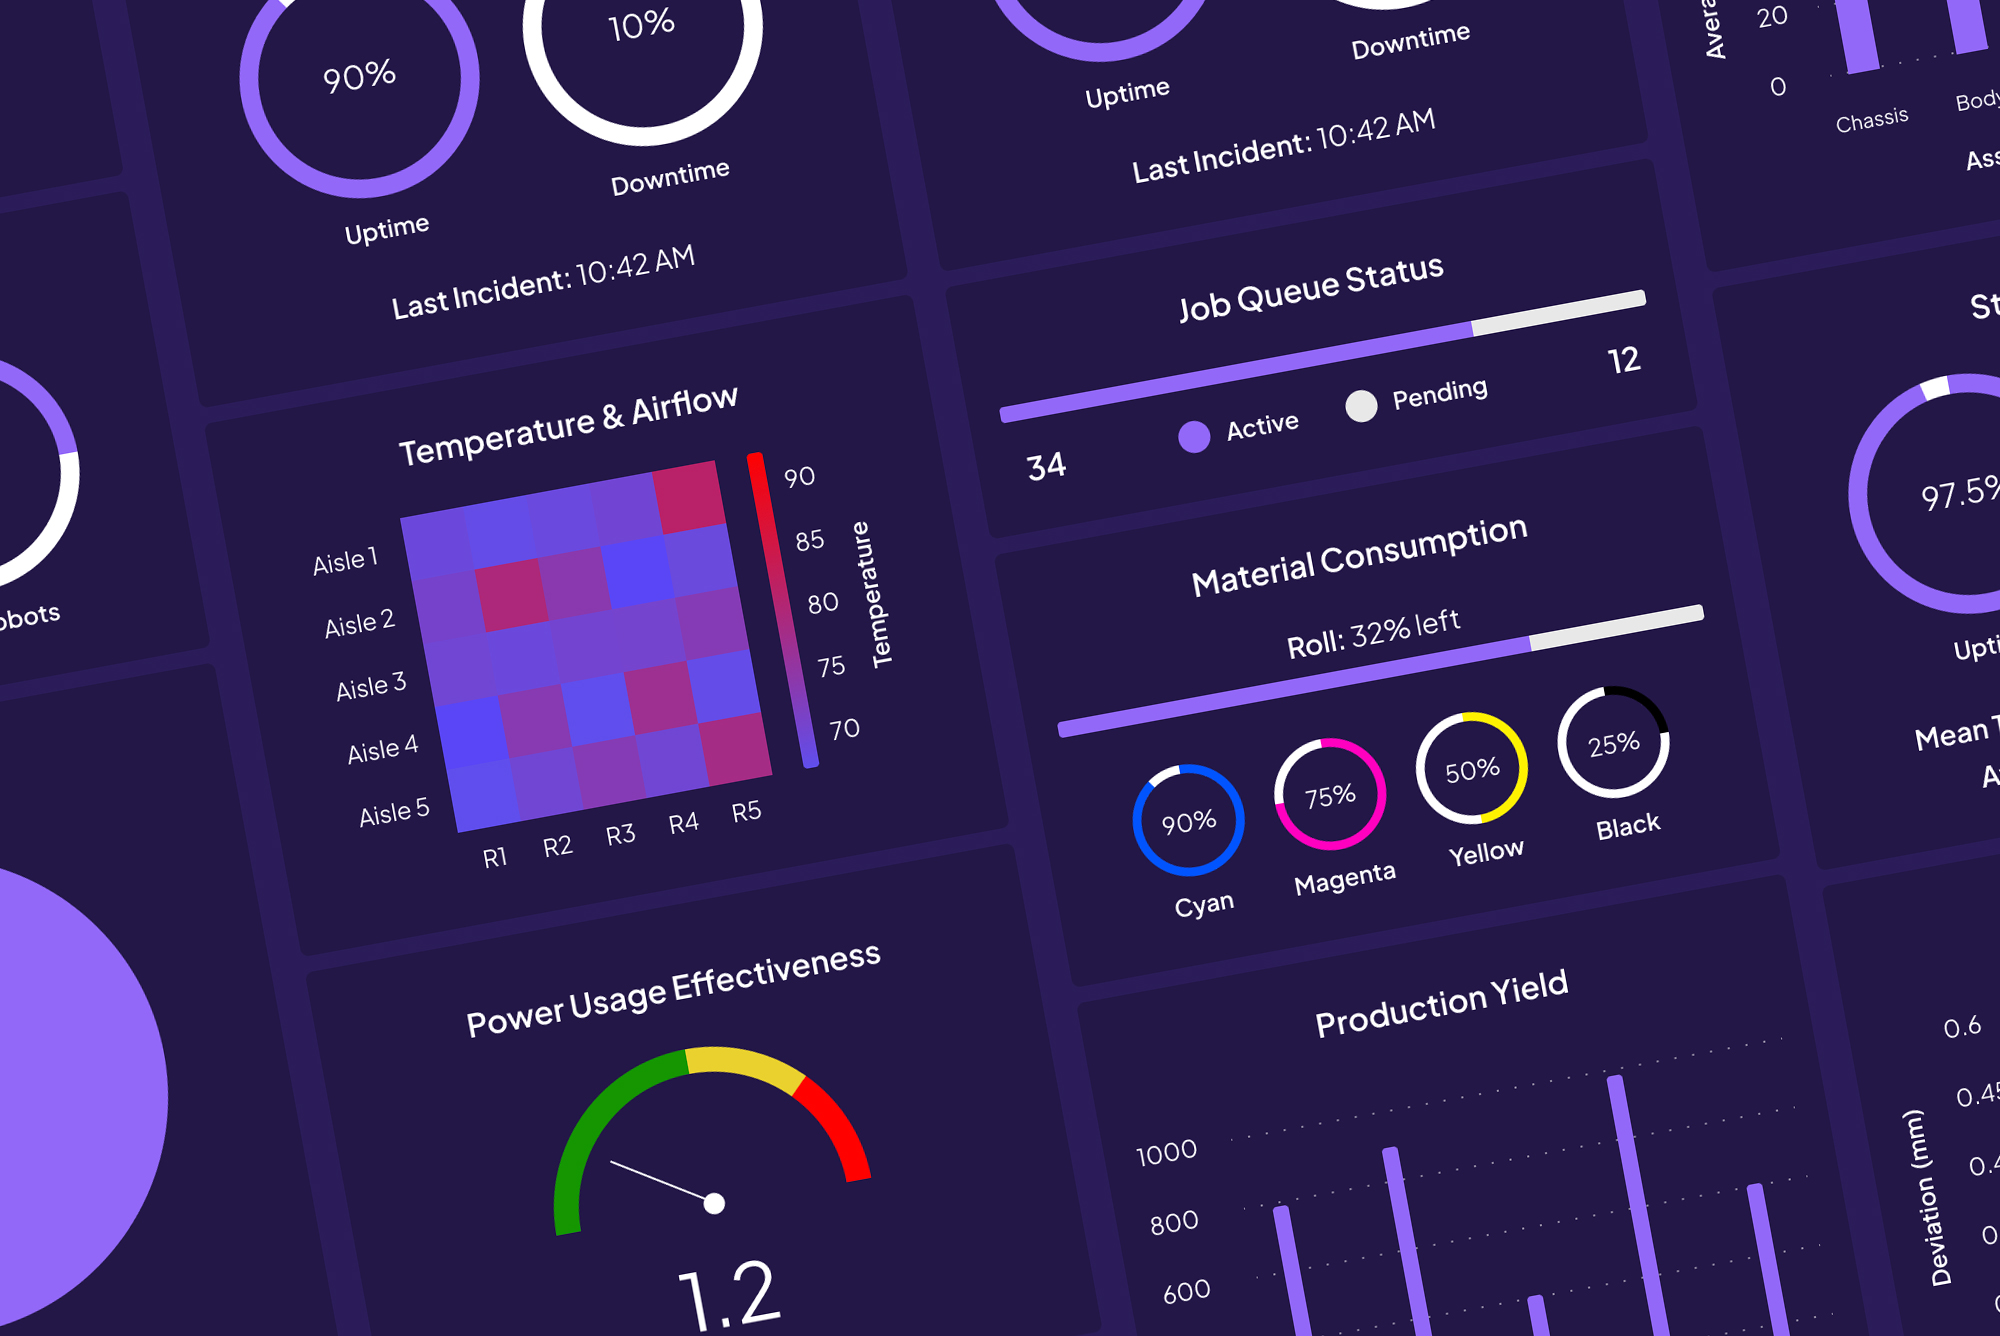
What It Looks Like
Imagine walking through your entire production line from a control room — except every part of it is alive with data. You watch robot arms complete cycles, see performance metrics hovering in AR-style overlays, and inspect real-time sensor health.
If a motor overheats, the affected machine pulses red. If defects spike at an inspection station, the anomaly spreads through the line visually. Managers don’t just read about a problem — they seethe cause, the ripple effects, and the best response.
Benefits to Manufacturers
• 30–50% faster root-cause analysis
• Reduced downtime through predictive visualization
• Better collaboration between operators, engineers, and managers
• More accurate planning because future load and bottlenecks are visually simulated
This is Industry 4.0 without the fluff — clear, intuitive, and actionable.
2. Finance: The Immersive Financial Cityscape
Financial data lives in spreadsheets, databases, BI dashboards, and a forest of PDFs. SurrealXP unifies it into an immersive analytical environment that reveals patterns instantly.
How It Works
SurrealXP pulls in portfolio data, market data, risk models (Snowflake or Azure), revenue metrics (Power BI), SAP financials, and operational KPIs. It then creates a city of data, where buildings, lights, and movement represent real metrics.
What It Looks Like
• Every business unit becomes a district
• Each metric becomes a building or structure
• Building height = performance
• Color = status
• Movement = volatility
• Roads light up when metrics correlate or influence each other
Analysts can fly through the “financial city,” zoom into a department, drill into accounts, and instantly see how a change affects the entire ecosystem.
Benefits to Financial Teams
• Faster anomaly detection (visual outliers stand out)
• Better cross-department understanding (everything is connected)
• Clearer risk communication to leadership
• Scenario simulations by adjusting variables in the environment
Finance often drowns in complexity. SurrealXP makes complexity visual, navigable, and explainable.
3. Energy & Utilities: Real-Time Grid Intelligence
Power grids, oil pipelines, water systems, and telecom networks are enormous, dynamic systems where failures cascade quickly. SurrealXP gives operators a real-time, spatial view of the entire network.
How It Works
Live data streams from SCADA systems, IoT sensors, maintenance databases, and Azure cloud services feed into SurrealXP’s simulation layer.
What It Looks Like
• Flow lines glow to show energy movement
• Sensor failures pulse as hotspots
• Outages ripple through nodes
• Predictive modeling shows where failures will occur
• Maintenance crews appear as moving entities with live status
If a substation goes down, you see the power reroute instantly. If network traffic spikes, overloaded segments throb visibly.
Benefits to Utilities
• Faster response times through visual detection
• Better outage planning with scenario simulations
• Cross-team coordination using shared immersive control rooms
• Improved resilience by understanding how failures propagate
SurrealXP becomes a living map of infrastructure — one you can learn from and act on in real time.
4. Logistics & Supply Chain: Live Flow Mapping
Supply chains are hard because they span nations, systems, and dozens of variables you don’t control. SurrealXP gives leaders a unified, explorable view of the entire chain.
How It Works
Data comes from ERPs, WMS systems, RFID, sensor networks, transportation APIs, and cloud analytics.
What It Looks Like
• Products move across a virtual global map
• Ports, warehouses, and routes light up with health indicators
• Container statuses update visually
• Delays propagate through the network like waves
• AI predictions show tomorrow’s bottlenecks today
Benefits to Supply Chain Teams
• More accurate forecasting by seeing demand/supply visually
• Better route optimization
• Real-time disruption response
• Improved collaboration between logistics, sales, ops, and customers
Supply chains stop being invisible and become observable, navigable systems.
5. Field Operations & Safety: Hazard Mapping in 3D
SurrealXP is powerful for teams responsible for field work, safety audits, and physical risk monitoring.
How It Works
SurrealXP integrates environmental sensors, safety logs, HR data, and audit findings into a spatial model of the environment.
What It Looks Like
• Hazard zones glow in heatmaps
• Worker proximity to high-risk equipment updates live
• Incident patterns appear as clusters
• Predictive models outline potential future hazards
Benefits
• Reduced incidents through better hazard visibility
• Faster safety reporting
• Higher operational awareness across teams
This is safety intelligence that doesn’t require guesswork or six meetings.
The Hidden Power: Multi-User Collaboration
One of SurrealXP’s greatest strengths is its collaborative layer.
Multiple people — from different locations — can enter the same immersive space, point at objects, annotate data, compare scenarios, and make decisions together.
This is not “shared screen” collaboration. This is:
• shared space
• shared context
• shared understanding
The meeting becomes hands-on, visual, and fast.
Built for the Real World, Not Just Showrooms
SurrealXP integrates with real enterprise systems you already use:
• Microsoft Fabric
• Power BI
• SAP
• Snowflake
• Azure Services
It doesn’t replace BI tools — it extends them and fuses their outputs into a single, operational view.
Behind the scenes, SurrealXP uses Omniverse’s USD (Universal Scene Description) as the data backbone, ensuring that every object in your environment is linked to real data and can update at runtime.
This is not a toy. It’s built on industrial-grade foundations.
The Business Case: Why Companies Adopt SurrealXP
Companies don’t buy technology because it looks cool. They buy it because it:
• saves time
• reduces cost
• increases clarity
• prevents downtime
•improves decisions
• unifies teams
Here are the measurable outcomes companies report:
1. 2x–5x faster decision cycles
When teams understand the situation instantly, decisions follow.
2. 30–50% faster root-cause analysis
Spatial visualization reveals problems dashboards hide.
3. Better forecasting accuracy
Seeing systems interact gives a clearer operational picture.
4. Lower downtime and operational risk
Predictive visualization + real-time monitoring = stability.
5. Stronger cross-functional alignment
Everyone finally sees the same thing.
SurrealXP Isn’t the Future — It’s the New Normal
Industries have been waiting for a tool that turns their disconnected systems into a living model of their enterprise. AI and cloud platforms generate the data. Omniverse provides the backbone. SurrealXP brings it to life. It’s not science fiction. It’s not metaverse hype. It’s practical, grounded, and already delivering value.
If the last decade was about collecting data, the next decade is about seeing it, understanding it, and acting on it instantly. SurrealXP is the platform built for that shift.