Manufacturing operations rarely fail all at once.
They drift.
A bearing begins running slightly hotter than expected.
A rotary die starts cutting just outside tolerance.
A packaging line slowly loses throughput.
At first the signal looks small.
But in modern industrial environments, small signals rarely stay small for long.
Manufacturing systems today are tightly interconnected across machines, material flows, supplier networks, and digital control systems. A minor deviation in one part of the process can quickly cascade across production lines, downstream logistics, and maintenance schedules.
And the financial impact of those cascades is significant.
According to research from the Siemens “True Cost of Downtime” study, unplanned downtime now costs large industrial manufacturers between $260,000 and $2 million per hour depending on the industry. Automotive manufacturing in particular has been estimated to lose more than $2 million per hour of downtime when production lines stop unexpectedly.
The signals that lead to these failures almost always exist before the disruption occurs.
The challenge isn’t collecting the data.
It’s seeing the signal early enough—and understanding it in operational context.
The Limits of Traditional Operational Visibility
Over the last decade, manufacturers have invested heavily in digital infrastructure.
Modern factories generate enormous volumes of operational data through systems like:
- MES platforms tracking production states and throughput
- SCADA systems monitoring equipment behavior and control loops
- IoT sensors streaming telemetry from machines and environmental systems
- ERP platforms coordinating supply chains, scheduling, and materials
In theory, this should provide unprecedented visibility into factory operations.
In practice, it often produces the opposite.
Operational data is fragmented across dozens of systems—each optimized for a specific function but rarely designed to work together in real time.
Production dashboards show throughput.
Maintenance systems track component health.
Analytics tools surface historical trends.
But when something starts going wrong on the production floor, teams often have to reconstruct the operational story manually.
This fragmentation is a well-documented issue. In a 2021 report on digital manufacturing, McKinsey noted that many industrial organizations struggle with “data silos that prevent operational teams from building a unified view of production systems.”
And while teams are trying to reconcile those signals, the line continues running.
Or worse—it stops.
When Operational Coordination Breaks Down
In 2022, Toyota experienced a real-world example of how fragile modern production coordination can be.
A failure in a supplier’s production management database at Kojima Industries disrupted the flow of manufacturing instructions to Toyota’s assembly plants.
Because Toyota operates under a tightly optimized just-in-time manufacturing model, even a short disruption in digital coordination between supplier systems and factory operations forced the company to halt production.
The result:
• 14 manufacturing plants temporarily shut down
• Approximately 13,000 vehicles not produced in a single day
The failure wasn’t mechanical.
It was operational.
The systems responsible for coordinating suppliers, production schedules, and manufacturing processes lost visibility into one another.
As Nikkei Asia reported at the time, once the coordination layer failed, Toyota had no way to quickly restore production synchronization across its plants.
Events like this highlight an important reality for modern manufacturing:
Operational resilience increasingly depends on how well digital systems coordinate production—not just how well machines perform individually.
Why Predictive Operations Require More Than Dashboards
Most factories today already have dashboards.
In many cases, they have too many.
Dashboards are excellent at reporting metrics. They summarize machine performance, throughput, quality rates, and downtime events.
But dashboards rarely show how systems interact with one another in real time.
An engineer may see machine telemetry.
An operations manager sees production KPIs.
Maintenance teams track equipment lifecycle data.
But no one sees the entire operational system simultaneously.
This gap has become a common theme in industrial analytics research.
A Gartner report on Industrial IoT platforms noted that many manufacturers still rely on fragmented monitoring tools that “lack a unified operational context for decision-making.”
And that’s where predictive operations break down.
Preventing downtime isn’t just about monitoring equipment health.
It’s about understanding how equipment behavior affects the rest of the system.
Why Spatial Context Is Emerging in Industrial Operations
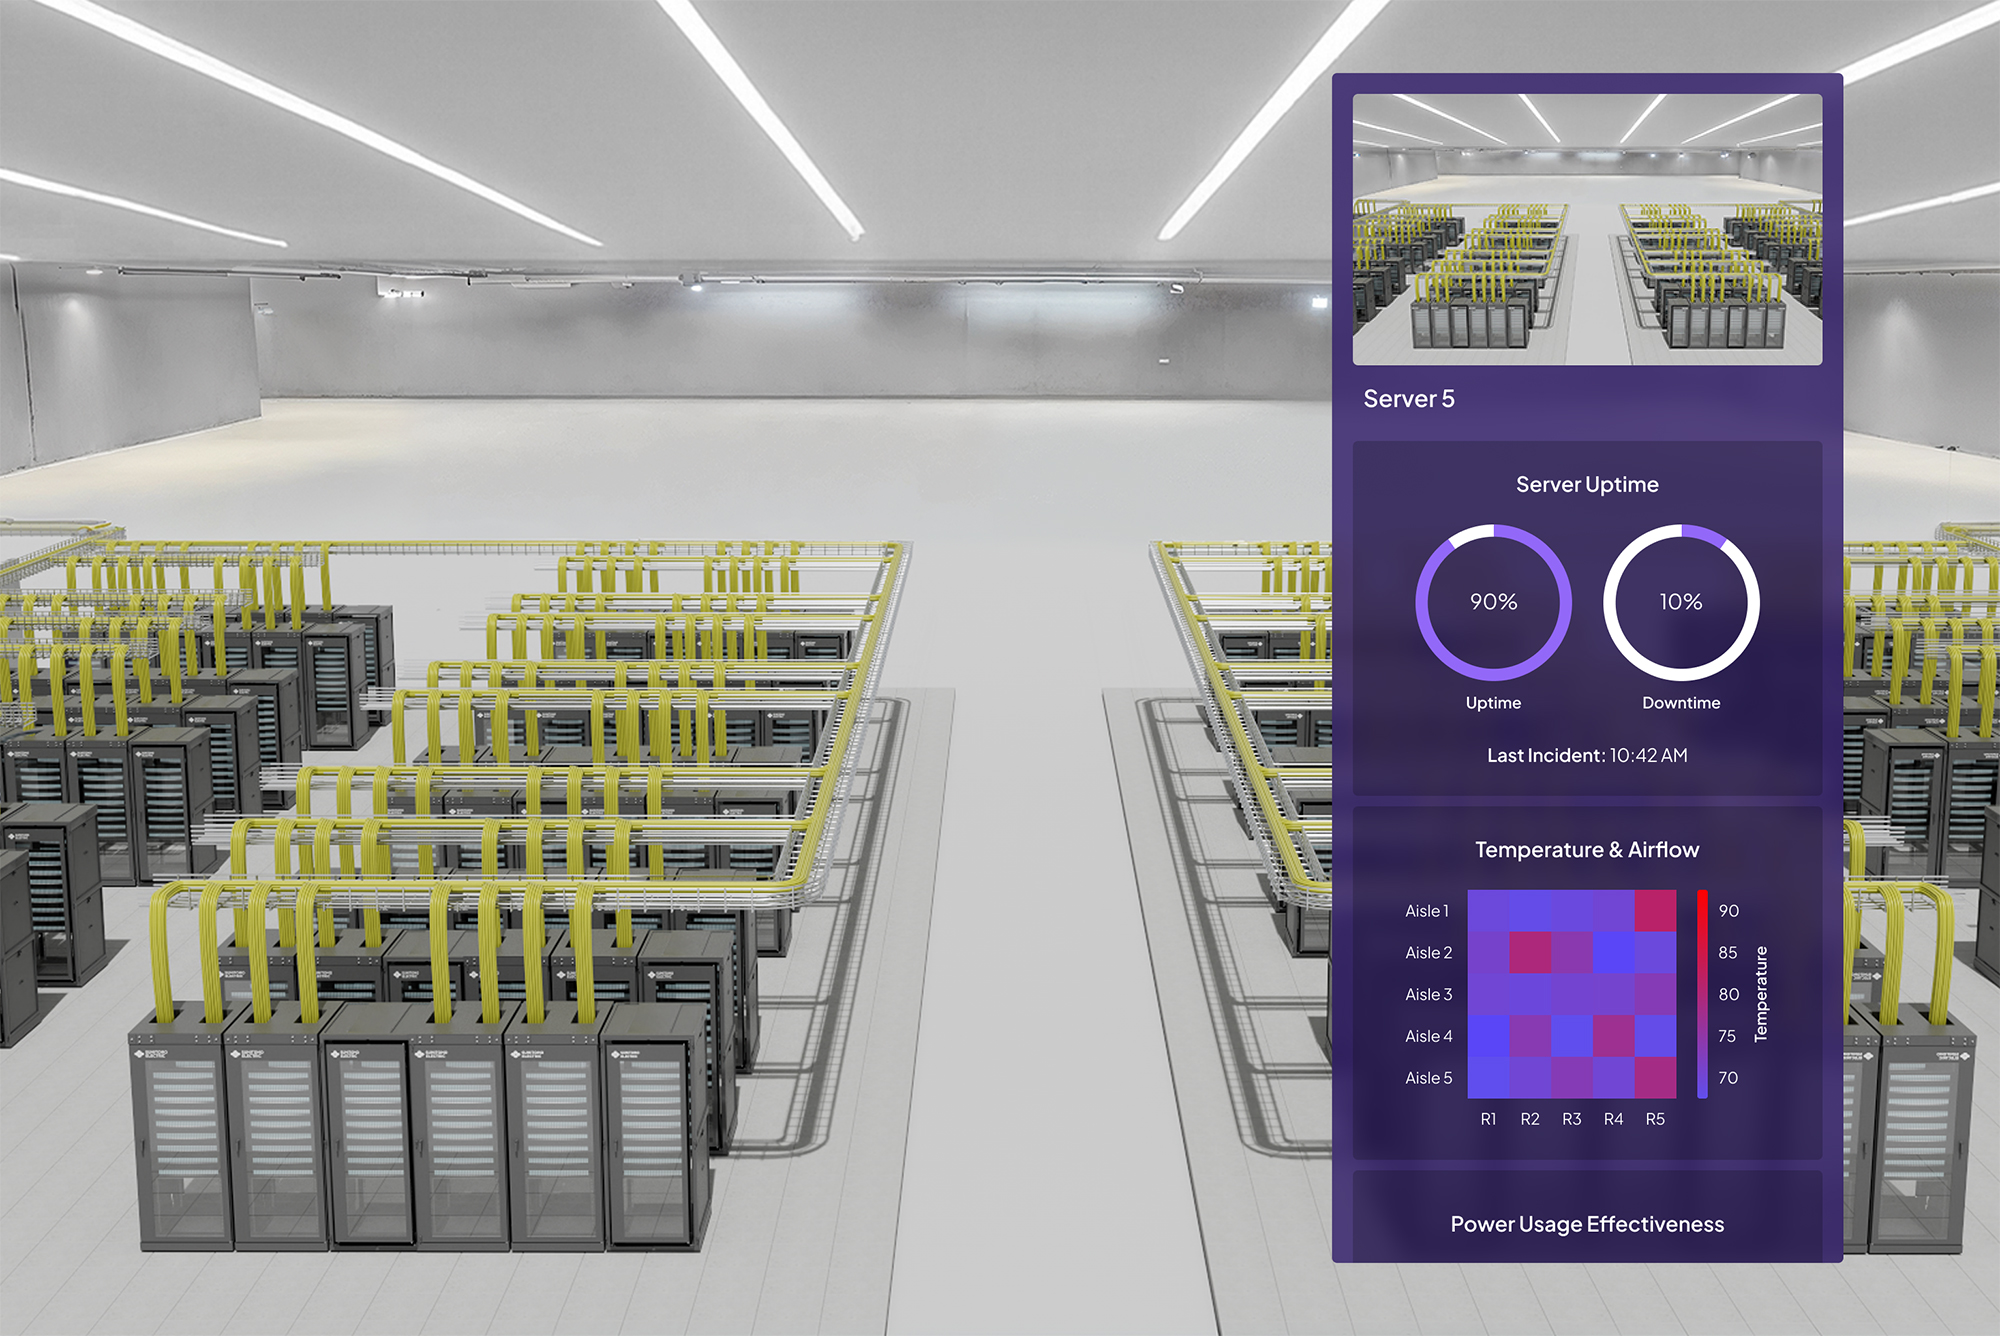
As industrial environments become more complex, many organizations are beginning to move beyond traditional dashboards toward spatial operational environments.
Instead of interpreting system relationships through charts and tables, engineers and operators can observe assets, telemetry streams, and production metrics interacting within a digital representation of the facility.
This approach aligns naturally with the concept of digital twins, which analysts at firms like Gartner and McKinsey increasingly identify as a key component of Industry 4.0 strategies.
In a recent McKinsey analysis of industrial digital twins, researchers noted that companies using digital twin environments for operations and maintenance achieved up to a 15% reduction in downtime and a 10–20% improvement in operational efficiency.
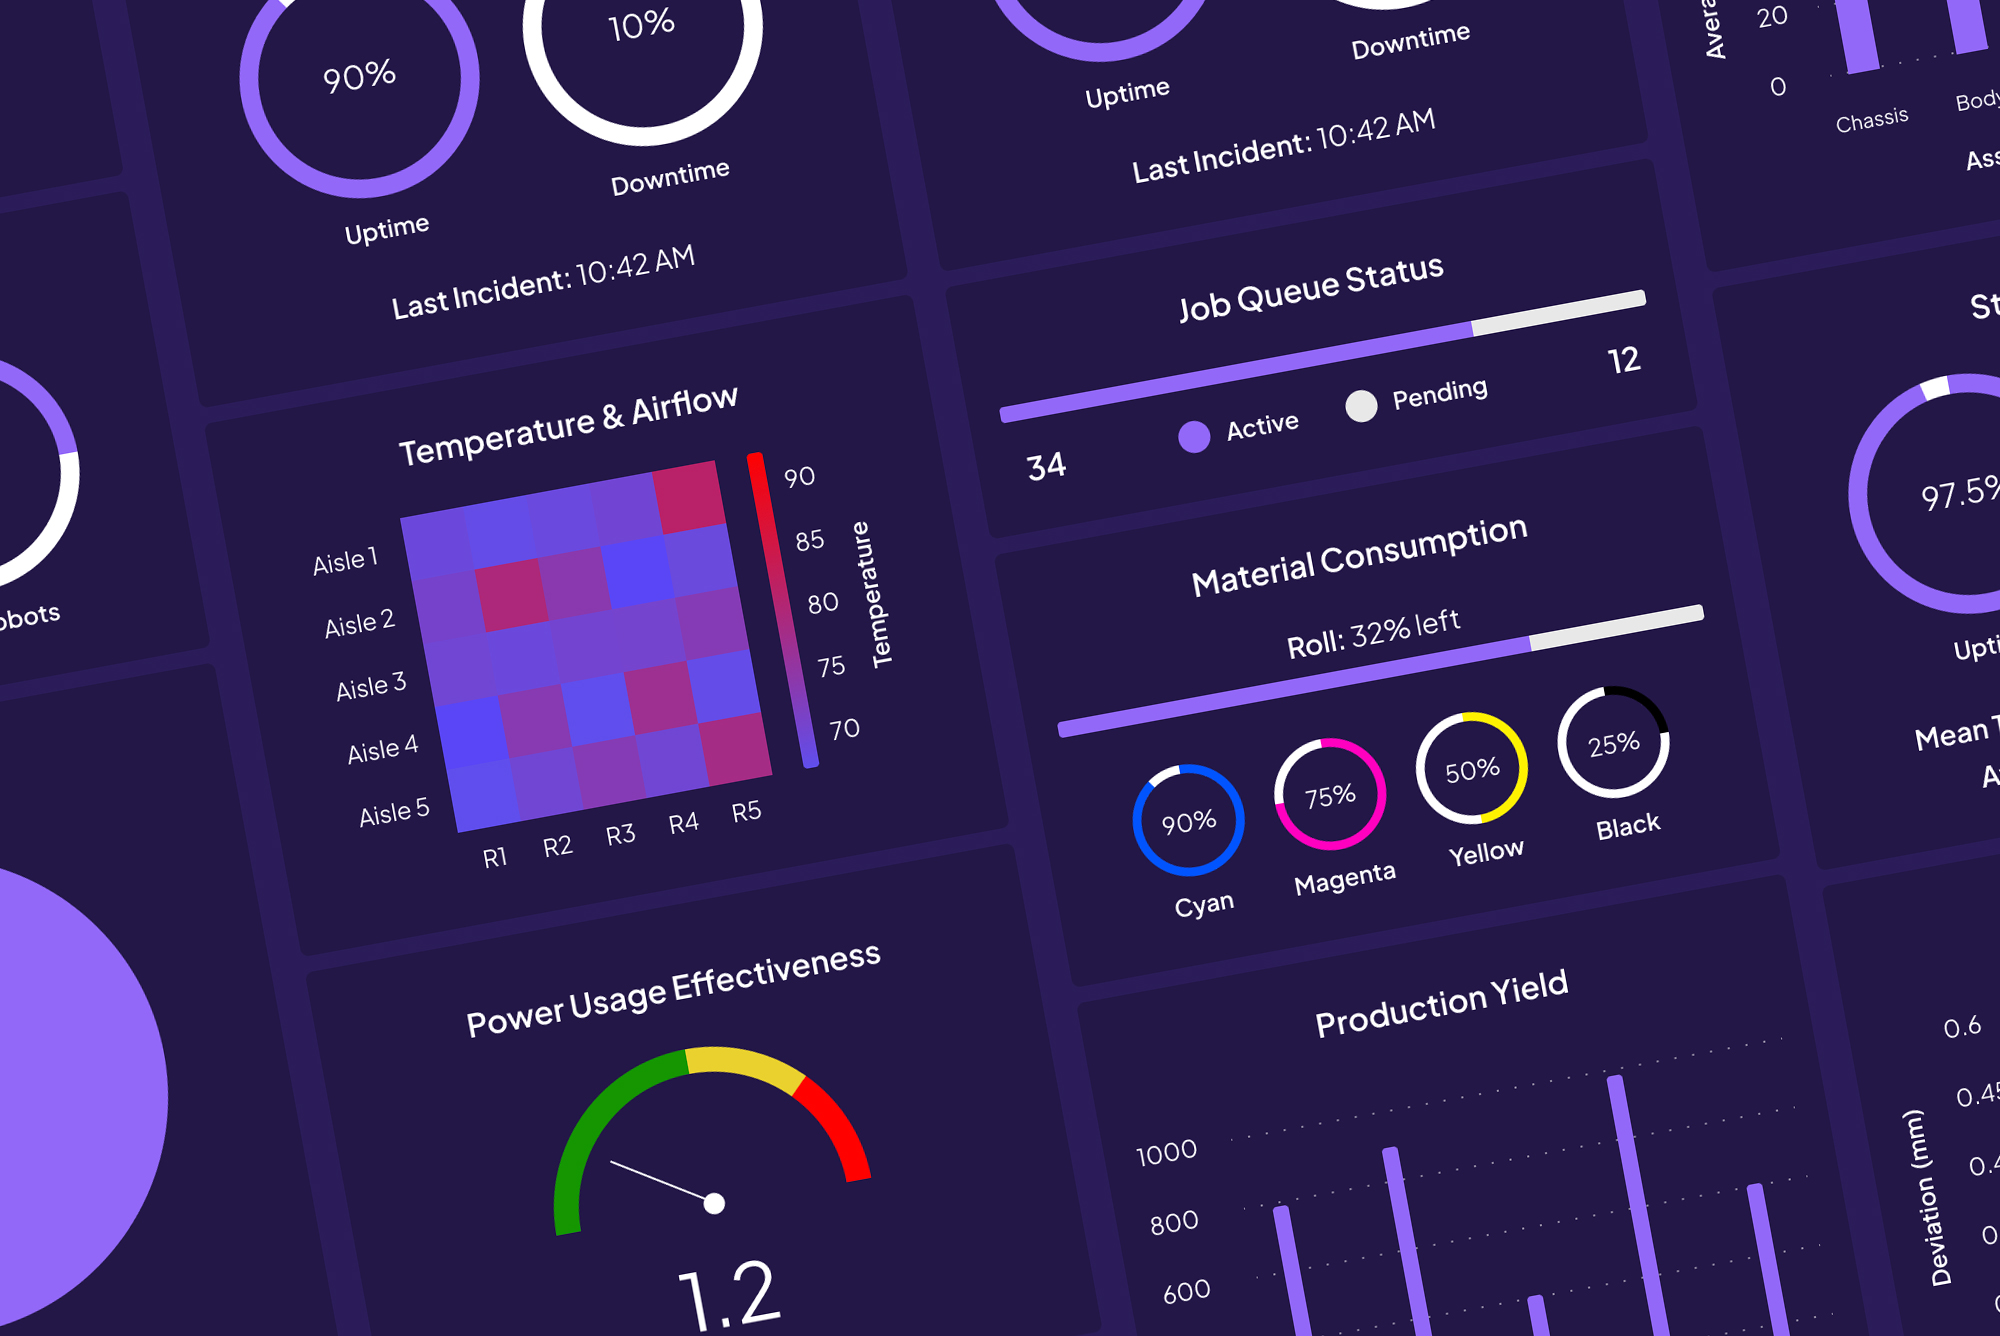
Inside these environments:
Machines, production lines, and facility infrastructure exist within a shared visual model of the operation.
Operational data is attached directly to the systems it represents.
When something changes, teams don’t just see a number update.
They see where the change is happening—and how it affects the system around it.
Connecting Real-Time Data to Operational Context
SurrealXP was designed to address this coordination problem.
Built on NVIDIA’s Omniverse platform, SurrealXP connects enterprise systems, real-time telemetry streams, and digital twin environments into a shared operational layer.
Production assets, operational metrics, and machine telemetry appear together inside a live 3D environment representing the real operation.
When something changes, teams see it immediately.
Instead of navigating multiple dashboards, they can:
• identify emerging issues across production systems
• simulate corrective actions inside the digital twin
• validate outcomes before implementing changes on the floor
This transforms operational visibility from retrospective reporting into predictive decision-making.